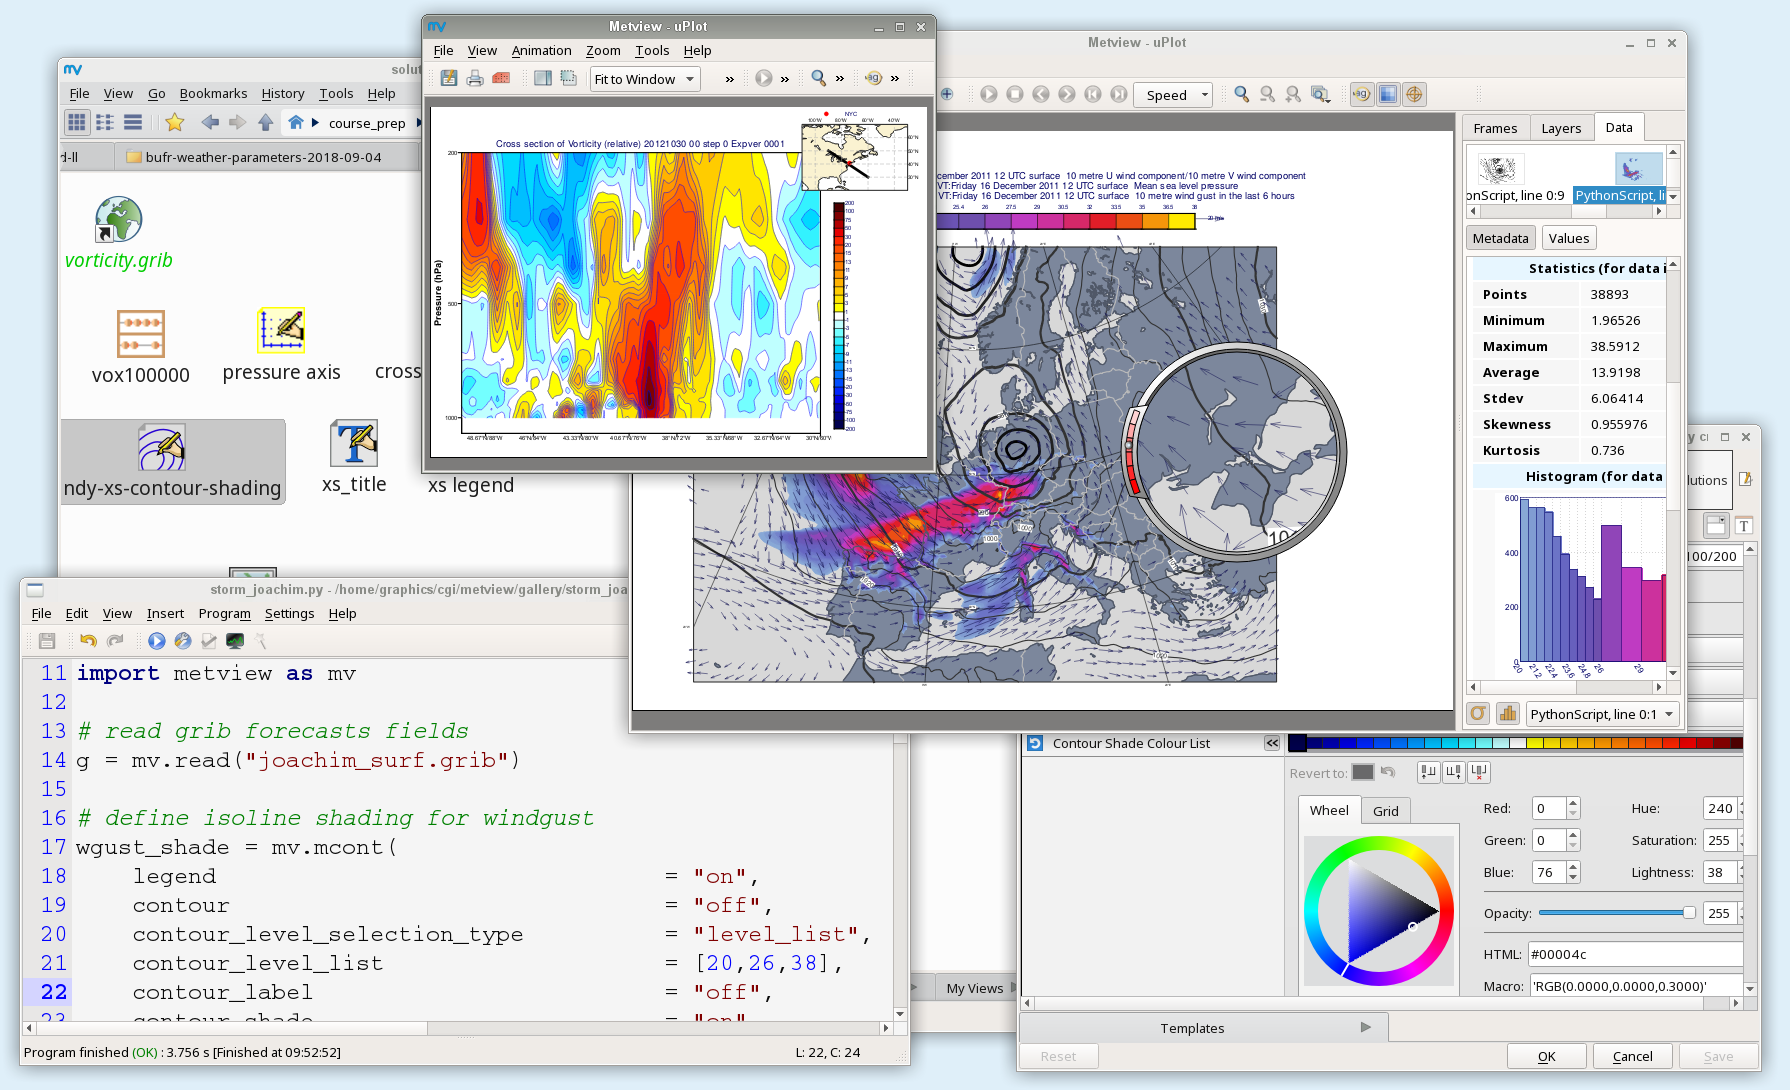
It features a powerful icon-based user interface for interactive work, a bespoke scripting language (Macro) and a Python interface for batch processing with integrated support for plots within Jupyter notebooks. These are linked through the ability to automatically convert icons into their equivalent script (Macro/Python) code.
Metview can take input data from a variety of sources, including:
- GRIB files (editions 1 and 2)
- BUFR files
- MARS (ECMWF's meteorological archive)
- ODB (Observation Database)
- Local databases
- ASCII data files (CSV, grids and scattered data)
- Geopoints (Metview's own format for handling scattered data)
- NetCDF
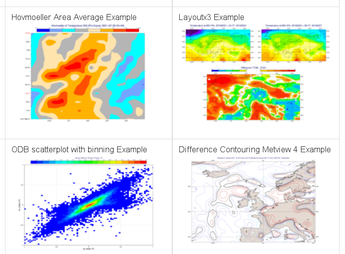
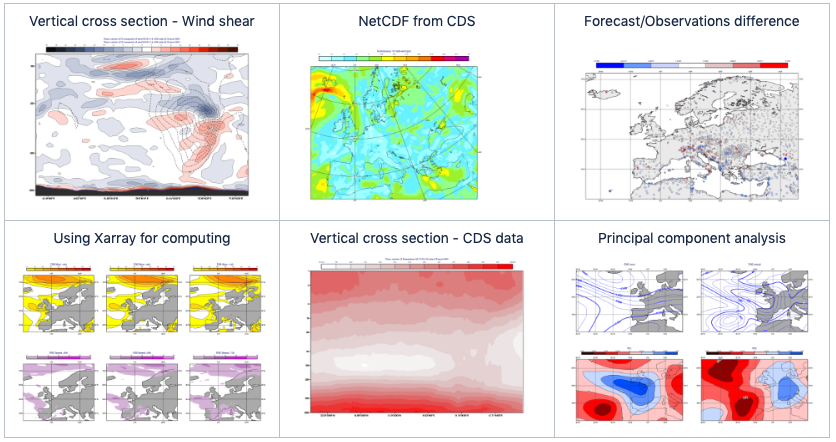
Powerful data filtering and processing facilities are then available, and if graphics output is desired, then Metview can produce many plot types, including:
- map views in various projections
- cross sections
- vertical profiles
- x/y graph plots
- intelligent overlay of data from various sources on the same map
- arrangement of multiple plots on the same page
Metview can also interface with external models and applications, such as VAPOR, Met3D, FLEXTRA and FLEXPART.
Metview was developed as part of a cooperation between ECMWF and INPE (Brazilian National Institute for Space Research).
Please send an email to software.support@ecmwf.int or go to Issues if you have any suggestions for improvements or have discovered a bug with this software package
Recently Updated
It features a powerful icon-based user interface for interactive work, a bespoke scripting language (Macro) and a Python interface for batch processing with integrated support for plots within Jupyter notebooks. These are linked through the ability to automatically convert icons into their equivalent script (Macro/Python) code.
Metview can take input data from a variety of sources, including:
- GRIB files (editions 1 and 2)
- BUFR files
- MARS (ECMWF's meteorological archive)
- ODB (Observation Database)
- Local databases
- ASCII data files (CSV, grids and scattered data)
- Geopoints (Metview's own format for handling scattered data)
- NetCDF
Powerful data filtering and processing facilities are then available, and if graphics output is desired, then Metview can produce many plot types, including:
- map views in various projections
- cross sections
- vertical profiles
- x/y graph plots
- intelligent overlay of data from various sources on the same map
- arrangement of multiple plots on the same page
Metview can also interface with external models and applications, such as VAPOR, Met3D, FLEXTRA and FLEXPART.
Metview was developed as part of a cooperation between ECMWF and INPE (Brazilian National Institute for Space Research).
Please send an email to software.support@ecmwf.int or go to Issues if you have any suggestions for improvements or have discovered a bug with this software package


